2012–2013: Full Fiscal Year
Table of contents
Overview
- Nutrition North Canada provided 61.3 million dollars in subsidy during its second year in operation. More than 25 million kg of nutritious perishable and non-perishable food as well as certain non-food items were subsidized in 2012-2013.
- Ten nutritious perishable foods accounted for more than half of the annual subsidy amount: fresh and frozen meat; fresh 2% milk; bread; frozen potato products; poultry; yogurt; eggs; fresh potatoes; bananas and UHT milk. These foods receive the program's higher subsidy level.
- Among the items eligible for the lower subsidy level, frozen pizza, unsweetened juice (in containers of more than 250 ml), ice cream and frozen combination foods received the most subsidy (accounting for 4% of the total).
- The Baffin Region of Nunavut and Northern Quebec (Nunavik) received 37% and 25% of the annual subsidy amount, nearly two-thirds of the program's subsidy budget. Nunavut alone received more than half of the annual subsidy amount, for a total of 55%.
- Retailers with stores in northern communities received 91% of the volume of subsidized products. These locally-operating stores make the subsidy available to the largest number of community residents as possible since most people shop at the local store. In 2012-2013, about 4% of the subsidized volume was shipped to individuals ("personal orders"), 3% to commercial establishments like hotels or restaurants and 2% to social institutions such as schools and day cares.
Data by Product Category
This table shows the amount of subsidy that was distributed by product category between April 1, 2012 and March 31, 2013, and the weight of the products that were subsidized during this period. Product categories are listed in descending order based on the amount of subsidy; the category that received the highest amount of subsidy is listed first, followed by the category that received the second highest amount of subsidy, and so on. Numbers in the table are preliminary. Values are subject to change.
| Product category | $ subsidy | % total $ | kg | % total kg |
|---|---|---|---|---|
| Fruit and vegetables (fresh and frozen) | 18,617,253 | 30% | 6,642,059 | 26% |
| Meat, poultry and fish (fresh and frozen) |
10,964,384 | 18% | 4,156,830 | 16% |
| Milk (fresh, UHT and canned evaporated) | 10,051,767 | 16% | 3,899,724 | 15% |
| Bread and bread products, cereals, crackers, flour and plain fresh and frozen pasta |
6,924,933 | 11% | 2,853,653 | 11% |
| Cheese, yogurt and other dairy products | 4,382,768 | 7% | 1,823,884 | 7% |
| Eggs and egg substitutes | 2,538,960 | 4% | 1,059,855 | 4% |
| Unsweetened juice | 2,498,008 | 4% | 1,152,198 | 4% |
| Eligible until October 1, 2012 | 2,125,840 | 3% | 2,033,900 | 8% |
| Combination foods (fresh and frozen) | 1,407,147 | 2% | 955,392 | 4% |
| Infant formula and foods prepared specifically for infants |
761,955 | 1% | 315,132 | 1% |
| Cooking oils, margarine, lard, shortening, butter, mayonnaise and salad dressing |
744,808 | 1% | 612,332 | 2% |
| Nuts, seeds, peanut butter and other nut butters, tofu and other meat alternatives |
254,476 | 0% | 88,869 | 0% |
| Country Food | 21,292 | 0% | 9,048 | 0% |
| Non-prescription drugs | 20,958 | 0% | 16,358 | 0% |
| Eligible only for the community of Old Crow, Yukon |
3,766 | 0% | 4,080 | 0% |
| Total | 61,318,316 | 100% | 25,623,316 | 100% |
| Note: Numbers may not add up due to rounding. | ||||
This chart shows what percentage of the total subsidy transfer between April 1, 2012 and March 31, 2013 was applied to specific product categories. Because non-prescription drugs and country foods shipped from registered northern processing plants received less than 1% of the subsidy transfer these categories are not shown in the chart. The chart is based on data in the table above.
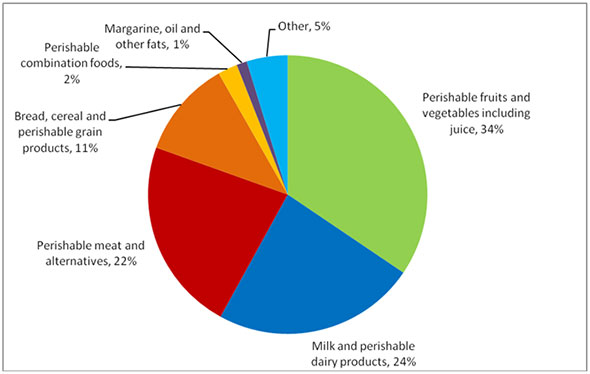
Description of image: Percentage of total subsidy payments
The pie graph breaks down the total amount of subsidy spending between April 1, 2011 and March 31, 2012, by categories of eligible products as follows:
- Perishable fruits and vegetables including juice: 34%
- Perishable meat and alternatives: 22%
- Milk and other perishable dairy products: 24%
- Bread, cereal and other perishable grain products: 11%
- Perishable combination foods: 2%
- Margarine, oil and other fats: 1%
- Other:
- Infant formula and infant foods: 1%
- Non-prescription drugs: 0%
- Eligible only for the community of Old Crow, Yukon: 0%
- Eligible until October 1, 2013: 3%
- Country Food: 0%.
Data by Province or Territory and Region
This table shows the amount of subsidy that was distributed by province or territory and region between April 1, 2012 and March 31, 2013, and the product quantities that were subsidized during this period. Within a province or territory, regions are listed in descending order based on the amount of subsidy; the region that received the highest amount of subsidy is listed first, followed by the region that received the second highest amount of subsidy, and so on. Numbers in the table are preliminary. Values are subject to change.
| Region | $ subsidy | % total $ | kg | % total kg |
|---|---|---|---|---|
| Nunavut | ||||
| Baffin | 22,395,668 | 37% | 5,962,152 | 23% |
| Kivalliq | 7,303,075 | 12% | 3,167,638 | 12% |
| Kitikmeot | 4,319,888 | 7% | 1,793,367 | 7% |
| 34,018,630 | 55% | 10,923,157 | 43% | |
| Quebec | ||||
| Nunavik (Northern Quebec) | 15,429,721 | 25% | 4,942,735 | 19% |
| Quebec North Shore † | 90,995 | 0% | 40,940 | 0% |
| 15,520,716 | 25% | 4,983,674 | 19% | |
| Northwest Territories | ||||
| Sahtu | 1,677,094 | 3% | 704,583 | 3% |
| Beaufort-Delta | 1,418,752 | 2% | 482,720 | 2% |
| Great Slave Lake | 3,277 | 0% | 65,509 | 0% |
| Deh Cho | 0 | 0% | 0 | 0% |
| 3,099,123 | 5% | 1,252,812 | 5% | |
| Manitoba | ||||
| 4,663,502 | 8% | 4,257,955 | 17% | |
| Ontario | ||||
| 2,525,094 | 4% | 3,265,641 | 13% | |
| Newfoundland and Labrador | ||||
| Labrador | 1,330,823 | 2% | 737,991 | 3% |
| Yukon | ||||
| 154,058 | 0% | 74,811 | 0% | |
| Saskatchewan | ||||
| 6,369 | 0% | 127,275 | 0% | |
| Total | 61,318,316 | 100% | 25,623,316 | 100% |
| † Quebec North Shore communities are eligible for a subsidy from Nutrition North Canada during the months when there is no marine service to these communities (generally from January to March). Note: Numbers may not add up due to rounding. |
||||
Data by Community
This table shows the amount of subsidy that was distributed by community between April 1, 2012 and March 31, 2013, and the product quantities that were subsidized during this period. Within a province or territory, communities are listed in alphabetic order. Numbers in the table are preliminary. Values are subject to change. Numbers in the table are preliminary. Values are subject to change.
| Community | $ subsidy | % total $ | kg | % total kg |
|---|---|---|---|---|
| Nunavut | ||||
| Arctic Bay | 1,717,099 | 3% | 208,738 | 1% |
| Arviat | 957,926 | 2% | 711,411 | 3% |
| Baker Lake | 1,792,336 | 3% | 618,957 | 2% |
| Cambridge Bay | 842,260 | 1% | 585,106 | 2% |
| Cape Dorset | 1,401,628 | 2% | 328,942 | 1% |
| Chesterfield Inlet | 387,161 | 1% | 138,376 | 1% |
| Clyde River | 1,672,539 | 3% | 270,194 | 1% |
| Coral Harbour | 842,047 | 1% | 226,538 | 1% |
| Gjoa Haven | 1,029,854 | 2% | 345,721 | 1% |
| Grise Fiord | 732,260 | 1% | 46,824 | 0% |
| Hall Bench | 955,696 | 2% | 182,647 | 1% |
| Igloolik | 2,432,388 | 4% | 470,253 | 2% |
| Iqaluit | 6,211,871 | 10% | 3,053,833 | 12% |
| Kimmirut | 642,871 | 1% | 126,695 | 0% |
| Kugaaruk | 694,569 | 1% | 193,359 | 1% |
| Kugluktuk | 923,620 | 2% | 416,181 | 2% |
| Pangnirtung | 1,665,050 | 3% | 441,508 | 2% |
| Pond Inlet | 3,161,479 | 5% | 408,394 | 2% |
| Qikiqtarjuaq | 627,745 | 1% | 141,953 | 1% |
| Rankin Inlet | 2,018,062 | 3% | 1,083,320 | 4% |
| Repulse Bay | 1,051,895 | 2% | 278,402 | 1% |
| Resolute | 903,525 | 1% | 91,453 | 0% |
| Sanikiluaq | 271,516 | 0% | 190,720 | 1% |
| Taloyoak | 829,585 | 1% | 252,999 | 1% |
| Whale Cove | 253,647 | 0% | 110,635 | 0% |
| 34,018,630 | 55% | 10,923,157 | 43% | |
| Quebec | ||||
| Akulivik | 701,609 | 1% | 167,329 | 1% |
| Aupaluk | 323,526 | 0% | 78,598 | 0% |
| Blanc-Sablon | 3 | 0% | 61 | 0% |
| Chevery | 12,553 | 0% | 5,589 | 0% |
| Gethsémani (La Romaine) | 30,163 | 0% | 13,364 | 0% |
| Harrington Harbour | 5,778 | 0% | 2,539 | 0% |
| Inukjuak | 1,332,344 | 2% | 536,609 | 2% |
| Ivujivik | 549,535 | 1% | 110,089 | 0% |
| Kangiqsualujjuaq | 1,045,421 | 2% | 271,281 | 1% |
| Kangiqsujuaq | 1,055,311 | 2% | 221,941 | 1% |
| Kangirsuk | 861,000 | 1% | 174,901 | 1% |
| Kegaska | 30 | 0% | 610 | 0% |
| Kuujjuaq | 2,732,639 | 4% | 1,183,253 | 5% |
| Kuujjuarapik | 1,344,449 | 2% | 776,540 | 3% |
| La Tabatière | 6,966 | 0% | 3,084 | 0% |
| Lourdes-de-Blanc-Sablon | 0 | 0% | 0 | 0% |
| Mutton Bay | 725 | 0% | 318 | 0% |
| Puvirnituq | 1,984,782 | 3% | 566,585 | 2% |
| Quaqtaq | 578,522 | 1% | 115,076 | 0% |
| Saint-Augustin / Pakuashipi | 18,575 | 0% | 8,233 | 0% |
| Salluit | 2,202,008 | 4% | 461,368 | 2% |
| Tasiujaq | 375,180 | 1% | 100,465 | 0% |
| Tête-à-la-Baleine | 16,202 | 0% | 7,142 | 0% |
| Umiujaq | 343,395 | 1% | 178,700 | 1% |
| 15,520,716 | 25% | 4,983,674 | 19% | |
| Northwest Territories | ||||
| Aklavik | 138,868 | 0% | 101,987 | 0% |
| Colville Lake | 123,722 | 0% | 25,413 | 0% |
| Deline | 357,905 | 1% | 150,095 | 1% |
| Fort Good Hope | 350,171 | 1% | 139,332 | 1% |
| Gameti | 0 | 0% | 0 | 0% |
| Lutsel K'e | 3,276 | 0% | 65,497 | 0% |
| Norman Wells | 491,679 | 1% | 243,642 | 1% |
| Paulatuk | 287,730 | 0% | 85,594 | 0% |
| Sachs Harbour | 159,568 | 0% | 27,874 | 0% |
| Trout Lake | 0 | 0% | 0 | 0% |
| Tuktoyaktuk | 306,863 | 1% | 138,350 | 1% |
| Tulita | 353,617 | 1% | 146,102 | 1% |
| Ulukhaktok (Holman) | 525,723 | 1% | 128,916 | 1% |
| Wha Ti | 1 | 0% | 12 | 0% |
| 3,099,123 | 5% | 1,252,812 | 5% | |
| Manitoba | ||||
| Berens River | 2,777 | 0% | 55,483 | 0% |
| Bloodvein | 25 | 0% | 506 | 0% |
| Gods Lake Narrows | 401,273 | 1% | 409,243 | 2% |
| Gods River | 163,495 | 0% | 163,416 | 1% |
| Island Lake (Garden Hill) | 890,415 | 1% | 671,258 | 3% |
| Lac Brochet | 215,082 | 0% | 193,870 | 1% |
| Little Grand Rapids | 217,839 | 0% | 212,103 | 1% |
| Negginan (Poplar River) | 235,684 | 0% | 217,517 | 1% |
| Oxford House | 799,985 | 1% | 742,011 | 3% |
| Pauingassi | 52,649 | 0% | 74,296 | 0% |
| Red Sucker Lake | 233,425 | 0% | 178,343 | 1% |
| Shamattawa | 11,303 | 0% | 225,959 | 1% |
| St. Theresa Point | 1,022,389 | 2% | 784,455 | 3% |
| Waasagomach | 417,161 | 1% | 329,496 | 1% |
| 4,663,502 | 8% | 4,257,955 | 17% | |
| Ontario | ||||
| Angling Lake | 603 | 0% | 12,044 | 0% |
| Attawapiskat | 666,298 | 1% | 618,224 | 2% |
| Bearskin Lake | 141,657 | 0% | 153,394 | 1% |
| Big Trout Lake | 260,436 | 0% | 217,183 | 1% |
| Fort Albany | 249,971 | 0% | 254,982 | 1% |
| Fort Severn | 315,823 | 1% | 143,645 | 1% |
| Kasabonika | 12,975 | 0% | 259,353 | 1% |
| Kashechewan | 530,453 | 1% | 577,054 | 2% |
| Kingfisher Lake | 448 | 0% | 8,966 | 0% |
| Muskrat Dam | 69,707 | 0% | 72,915 | 0% |
| Peawanuck | 235,510 | 0% | 124,094 | 0% |
| Pikangikum | 18,265 | 0% | 365,155 | 1% |
| Sachigo Lake | 6,179 | 0% | 123,479 | 0% |
| Weagamow Lake | 7,553 | 0% | 150,930 | 1% |
| Wunnummin Lake | 9,216 | 0% | 184,221 | 1% |
| 2,525,094 | 4% | 3,265,641 | 13% | |
| Newfoundland and Labrador | ||||
| Black Tickle | 56,165 | 0% | 34,675 | 0% |
| Hopedale | 163,410 | 0% | 100,879 | 0% |
| Makkovik | 103,745 | 0% | 73,452 | 0% |
| Nain | 503,687 | 1% | 215,962 | 1% |
| Natuashish | 368,637 | 1% | 206,523 | 1% |
| Postville | 55,206 | 0% | 37,706 | 0% |
| Rigolet | 79,973 | 0% | 68,795 | 0% |
| 1,330,823 | 2% | 737,991 | 3% | |
| Yukon | ||||
| Old Crow | 154,058 | 0% | 74,811 | 0% |
| Saskatchewan | ||||
| Black Lake | 0 | 0% | 0 | 0% |
| Fond-du-Lac | 6,369 | 0% | 127,275 | 0% |
| Stony Rapids | 0 | 0% | 0 | 0% |
| 6,369 | 0% | 127,275 | 0% | |
| Total | 61,318,316 | 100% | 25,623,316 | 100% |
| * Quebec North Shore communities are eligible for a subsidy from Nutrition North Canada during the months when there is no marine service to these communities (generally from January to March). n/a = not applicable Note: Numbers may not add up due to rounding. |
||||
Data per Capita
This table shows the amount of subsidy that was distributed and the product quantities that were subsidized between April 1, 2012 and March 31, 2013, on a per capita (per person) basis. The table includes all communities that were eligible for a full subsidy. Population counts from the 2011 Census were used to calculate the per capita values. Within a province or territory, communities are listed in alphabetical order. Numbers in the table are preliminary. Values are subject to change.
| Community | Population | $ subsidy | $ per capita | kg | kg per capita |
|---|---|---|---|---|---|
| Nunavut | |||||
| Arctic Bay | 823 | 1,717,099 | 2,086 | 208,738 | 254 |
| Arviat | 1,810 | 957,926 | 529 | 711,411 | 393 |
| Baker Lake | 1,872 | 1,792,336 | 957 | 618,957 | 331 |
| Cambridge Bay | 1,608 | 842,260 | 524 | 585,106 | 364 |
| Cape Dorset | 1,363 | 1,401,628 | 1,028 | 328,942 | 241 |
| Chesterfield Inlet | 313 | $304,415 | $973 | 140,518 | 449 |
| Clyde River | 934 | 1,672,539 | 1,791 | 270,194 | 289 |
| Coral Harbour | 834 | 842,047 | 1,010 | 226,538 | 272 |
| Gjoa Haven | 1,279 | 1,029,854 | 805 | 345,721 | 270 |
| Grise Fiord | 130 | 732,260 | 5,633 | 46,824 | 360 |
| Hall Beach | 546 | 955,696 | 1,750 | 182,647 | 335 |
| Igloolik | 1,454 | 2,432,388 | 1,673 | 470,253 | 323 |
| Iqaluit | 6,699 | 6,211,871 | 927 | 3,053,833 | 456 |
| Kimmirut | 455 | 642,871 | 1,413 | 126,695 | 278 |
| Kugaaruk | 771 | 694,569 | 901 | 193,359 | 251 |
| Kugluktuk | 1,450 | 923,620 | 637 | 416,181 | 287 |
| Pangnirtung | 1,425 | 1,665,050 | 1,168 | 441,508 | 310 |
| Pond Inlet | 1,549 | 3,161,479 | 2,041 | 408,394 | 264 |
| Qikiqtarjuaq | 520 | 627,745 | 1,207 | 141,953 | 273 |
| Rankin Inlet | 2,266 | 2,018,062 | 891 | 1,083,320 | 478 |
| Repulse Bay | 945 | 1,051,895 | 1,113 | 278,402 | 295 |
| Resolute | 214 | 903,525 | 4,222 | 91,453 | 427 |
| Sanikiluaq | 812 | 271,516 | 334 | 190,720 | 235 |
| Taloyoak | 899 | 829,585 | 923 | 252,999 | 281 |
| Whale Cove | 407 | 253,647 | 623 | 110,635 | 272 |
| Quebec | |||||
| Akulivik | 615 | 701,609 | 1,141 | 167,329 | 272 |
| Aupaluk | 195 | 323,526 | 1,659 | 78,598 | 403 |
| Chevery | 251 | 12,553 | 50 | 5,589 | 22 |
| Gethsémani (La Romaine) | 1,016 | 30,163 | 30 | 13,364 | 13 |
| Harrington Harbour | 261 | 5,778 | 22 | 2,539 | 10 |
| Inukjuak | 1,597 | 1,332,344 | 834 | 536,609 | 336 |
| Ivujivik | 370 | 549,535 | 1,485 | 110,089 | 298 |
| Kangiqsualujjuaq | 874 | 1,045,421 | 1,196 | 271,281 | 310 |
| Kangiqsujuaq | 696 | 1,055,311 | 1,516 | 221,941 | 319 |
| Kangirsuk | 549 | 861,000 | 1,568 | 174,901 | 319 |
| Kuujjuaq | 2,375 | 2,732,639 | 1,151 | 1,83,253 | 498 |
| Kuujjuarapik | 1,531 | 1,344,449 | 878 | 776,540 | 507 |
| La Tabatière | 359 | 6,966 | 19 | 3,084 | 9 |
| Puvirnituq | 1,692 | 1,984,782 | 1,173 | 566,585 | 335 |
| Quaqtaq | 376 | 578,522 | 1,539 | 115,076 | 306 |
| Saint-Augustin / Pakuashipi | 478 | 18,575 | 39 | 8,233 | 17 |
| Salluit | 1,347 | 2,202,008 | 1,635 | 461,368 | 343 |
| Tasiujaq | 303 | 375,180 | 1,238 | 100,465 | 332 |
| Tête-à-la-Baleine | 129 | 16,202 | 126 | 7,142 | 55 |
| Umiujaq | 444 | 343,395 | 773 | 178,700 | 402 |
| Northwest Territories | |||||
| Aklavik | 633 | 138,868 | 219 | 101,987 | 161 |
| Colville Lake | 149 | 123,722 | 830 | 25,413 | 171 |
| Deline | 472 | 357,905 | 758 | 150,095 | 318 |
| Fort Good Hope | 515 | 350,171 | 680 | 139,332 | 271 |
| Norman Wells | 727 | 491,679 | 676 | 243,642 | 335 |
| Paulatuk | 313 | 287,730 | 919 | 85,594 | 273 |
| Sachs Harbour | 112 | 159,568 | 1,425 | 27,874 | 249 |
| Tuktoyaktuk | 854 | 306,863 | 359 | 138,350 | 162 |
| Tulita | 478 | 353,617 | 740 | 146,102 | 306 |
| Ulukhaktok (Holman) | 402 | 525,723 | 1,308 | 128,916 | 321 |
| Manitoba | |||||
| Gods Lake Narrows | 1,341 | 401,273 | 299 | 409,243 | 305 |
| Gods River | 596 | 163,495 | 274 | 163,416 | 274 |
| Island Lake (Garden Hill) | 2,776 | 890,415 | 321 | 671,258 | 242 |
| Lac Brochet | 816 | 215,082 | 264 | 193,870 | 238 |
| Little Grand Rapids | 847 | 217,839 | 257 | 212,103 | 250 |
| Negginan (Poplar River) | 848 | 235,684 | 278 | 217,517 | 257 |
| Oxford House | 1,864 | 799,985 | 429 | 742,011 | 398 |
| Pauingassi | 388 | 52,649 | 136 | 74,296 | 191 |
| Red Sucker Lake | 781 | 233,425 | 299 | 178,343 | 228 |
| St. Theresa Point | 2,871 | 1,022,389 | 356 | 784,455 | 273 |
| Waasagomach | 1,411 | 417,161 | 296 | 329,496 | 234 |
| Ontario | |||||
| Attawapiskat | 1,549 | 666,298 | 430 | 618,224 | 399 |
| Bearskin Lake | 459 | 141,657 | 309 | 153,394 | 334 |
| Big Trout Lake | 904 | 260,436 | 288 | 217,183 | 240 |
| Fort Albany | 900 | 249,971 | 278 | 254,982 | 283 |
| Fort Severn | 334 | 315,823 | 946 | 143,645 | 430 |
| Kashechewan | 1,200 | 530,453 | 442 | 577,054 | 481 |
| Muskrat Dam | 260 | 69,707 | 268 | 72,915 | 280 |
| Peawanuck | 237 | 235,510 | 994 | 124,094 | 524 |
| Newfoundland and Labrador | |||||
| Black Tickle | 168 | 56,165 | 334 | 34,675 | 206 |
| Hopedale | 556 | 163,410 | 294 | 100,879 | 181 |
| Makkovik | 361 | 103,745 | 287 | 73,452 | 203 |
| Nain | 1,188 | 503,687 | 424 | 215,962 | 182 |
| Natuashish | 931 | 368,637 | 396 | 206,523 | 222 |
| Postville | 206 | 55,206 | 268 | 37,706 | 183 |
| Rigolet | 306 | 79,973 | 261 | 68,795 | 225 |
| Yukon | |||||
| Old Crow | 245 | 154,058 | 629 | 74,811 | 305 |
| Total | 75,834 | 61,238,566 | 808 | 24,043,446 | 317 |
| Note: Numbers may not add up due to rounding. | |||||
Data per Retailer or Supplier
This table shows the amount of subsidy that was distributed and the product quantities that were subsidized between April 1, 2012 and March 31, 2013, by registered retailer and supplier. Retailers and suppliers are listed in descending order based on the subsidy amount; the recipient that received the highest amount of subsidy is listed first, followed by the community that received the second highest amount of subsidy, and so on. Numbers in the table are preliminary. Values are subject to change.
| Retailer / supplier | $ subsidy | % total $ | kg | % total kg |
|---|---|---|---|---|
| NorthWest Company | 31,561,571 | 51% | 15,142,178 | 59% |
| Arctic Co-operatives Ltd. | 10,475,368 | 17% | 3,029,958 | 12% |
| Fédération des coopératives du Nouveau-Québec | 7,544,262 | 12% | 2,043,933 | 8% |
| Arctic Consultants | 2,680,551 | 4% | 809,761 | 3% |
| Marché Daoust Inc. | 2,292,832 | 4% | 837,597 | 3% |
| Ben Deshaies Inc. | 2,076,977 | 3% | 835,645 | 3% |
| Harris Meat & Groceries | 931,251 | 2% | 738,085 | 3% |
| Hamilton Wholesalers Ltd. | 595,762 | 1% | 325,199 | 1% |
| Arctic Ventures 2000 Ltd. | 452,339 | 1% | 229,138 | 1% |
| Labrador Investments Limited | 391,995 | 1% | 194,488 | 1% |
| Multi-Foods Limited | 305,324 | 0% | 185,248 | 1% |
| Pratts Wholesale / Food Service | 273,280 | 0% | 228,698 | 1% |
| Stanton Group Ltd. | 250,053 | 0% | 105,027 | 0% |
| Marché Central du Nord Inc. | 243,074 | 0% | 67,638 | 0% |
| Meechim North | 241,731 | 0% | 201,346 | 1% |
| Rampart Rentals | 221,141 | 0% | 106,282 | 0% |
| Valu Lots | 152,876 | 0% | 120,288 | 0% |
| Precambrian Wholesale (2010) Limited | 125,672 | 0% | 122,824 | 0% |
| Zudel's Grocery Ltd. | 124,363 | 0% | 102,112 | 0% |
| Arctic Buying Co. Kivalliq | 107,511 | 0% | 53,286 | 0% |
| Distribution Côte-Nord | 59,614 | 0% | 25,963 | 0% |
| M&M Meat Shops (Store #427) | 48,498 | 0% | 14,129 | 0% |
| Northern Fancy Meats | 30,363 | 0% | 11,482 | 0% |
| True North Community Co-operative | 28,731 | 0% | 22,112 | 0% |
| Public Meat | 26,332 | 0% | 27,821 | 0% |
| Distribution GFD Inc. | 21,799 | 0% | 10,774 | 0% |
| Pang Fisheries | 15,181 | 0% | 7,281 | 0% |
| AN Food Distributors | 11,257 | 0% | 4,361 | 0% |
| Distribution M Fournier | 7,846 | 0% | 3,445 | 0% |
| Kitikmeot Food Ltd. | 5,259 | 0% | 1,131 | 0% |
| Snelgroves Wholesale Ltd. | 3,559 | 0% | 8,696 | 0% |
| Arctic Connection | 3,473 | 0% | 2,056 | 0% |
| Sysco Food Services Winnipeg | 2,208 | 0% | 1,670 | 0% |
| Ecoproduce Canada | 1,942 | 0% | 852 | 0% |
| JG Grocery | 1,841 | 0% | 1,476 | 0% |
| Les Entreprises Henry Jenniss Inc. | 1,736 | 0% | 757 | 0% |
| Quality Market | 410 | 0% | 325 | 0% |
| Kivaliq Arctic Foods | 335 | 0% | 252 | 0% |
| Grand Total | 61,318,316 | 100% | 25,623,316 | 100% |
| Note: Numbers may not add up due to rounding. | ||||
Data by Client Type
This table shows the amount of subsidy that was distributed and the product quantities that were subsidized between April 1, 2012 and March 31, 2013, by the type of client that purchased the subsidized products. Numbers in the table are preliminary. Values are subject to change.
| Client | $ subsidy | % total $ | kg | % total kg |
|---|---|---|---|---|
| Retailers | 56,093,811 | 91% | 23,333,970 | 91% |
| Establishments ( e.g., restaurant) | 2,035,871 | 3% | 793,415 | 3% |
| Individuals ("personal orders") | 1,750,473 | 3% | 1,025,159 | 4% |
| Social Institutions ( e.g., daycare, school) | 1,438,160 | 2% | 470,772 | 2% |
| Total | 61,318,316 | 100% | 25,623,316 | 100% |
| Note: Numbers may not add up due to rounding. | ||||