Nutrition North Canada (NNC) provided over $32 million in subsidy during April, May and June 2020. This represents an increase of 47% compared to the same period last year.
Due to COVID-19, and the pressures the pandemic and subsequent lockdowns brought onto the supply chain and communities, NNC received $25 million in extra funding to increase all subsidy rates and allow all NNC communities access to goods usually reserved for air-only communities.
The highest subsidy level accounted for 12% of total subsidy spending this quarter. The level targets frozen fruits, frozen vegetables, fresh milk and infant formula/food.
The ten foods subsidized at the program's medium level accounted for about 67% of the subsidy - all fresh fruits, meat, all fresh vegetables, bread, yogurt, frozen potato products, eggs, flour, and unsweetened juice of 250ml and less, and poultry.
The top foods subsidized at the program's lowest level accounted for about 20% of the subsidy - unsweetened juice (containers of more than 250 ml), pizza, ice cream, tomato-based sauces, cream and cream cheese. This is similar to what was reported for the 1st quarter of 2019 to 2020.
Data by product category
This table shows the amount of subsidy that was distributed by product category between April 1, 2020 and June 30, 2020, and the quantity of products that were subsidized during this period. Product categories are listed in descending order based on the amount of subsidy. The category that received the highest amount of subsidy is listed first, followed by the category that received the second highest amount of subsidy, and so on. Values are subject to change. Numbers may not add up due to rounding.
Product category
Subsidy
Volume
Value ($)
% of Total
Weight (kg)
% of Total
Fruit and vegetables (fresh and frozen)
9,511,610
29.3%
2,656,885
25.4%
Milk (fresh, UHT and canned evaporated)
5,088,286
15.7%
1,415,782
13.5%
Meat, poultry and fish (fresh and frozen)
4,494,001
13.8%
1,403,560
13.4%
Bread and bread products, cereals, crackers, flour and plain fresh and frozen pasta.
2,456,812
7.6%
834,684
8.0%
Cheese, yogourt and other dairy products
1,696,816
5.2%
629,147
6.0%
Unsweetened juice
1,306,870
4.0%
414,334
4.0%
Eggs and egg substitutes
952,655
2.9%
262,755
2.5%
Infant products, formula and foods prepared specifically for infants
725,009
2.1%
725,009
2.8%
Eligible for Old Crow (Yukon) and COVID-19 usage
685,123
2.2%
291,493
6.9%
Cooking oils, margarine, lard, shortening, butter, mayonnaise and salad dressing
598,561
1.8%
349,466
3.3%
Combination foods (fresh and frozen)
598,561
1.8%
349,466
3.3%
Nuts, seeds, peanut butter and other nut butters, tofu and other meat alternatives
36,754
0.1%
10,087
0.1%
Personal Hygiene Products
31,335
0.0%
10,539
0.0%
Dried herbs & spices, cooking juice
11,708
0.1%
7,573
0.1%
Non-prescription drugs
685
0.0%
890
0.1%
Total
32,452,197
100%
10,476,283
100%
Data by subsidy level
This chart shows what percentage of total payments split between the different subsidy levels available between April 1, 2020 and June 30, 2020.
Data by subsidy levelText alternative for Data by subsidy level:
The pie graph breaks down the total amount of subsidy spending between April 1, 2020 and June 30, 2020, by subsidy level, as follows:
High: 12%
Medium: 67%
Low: 20%
Seasonal Transportation: 1%
Country Food: 0%
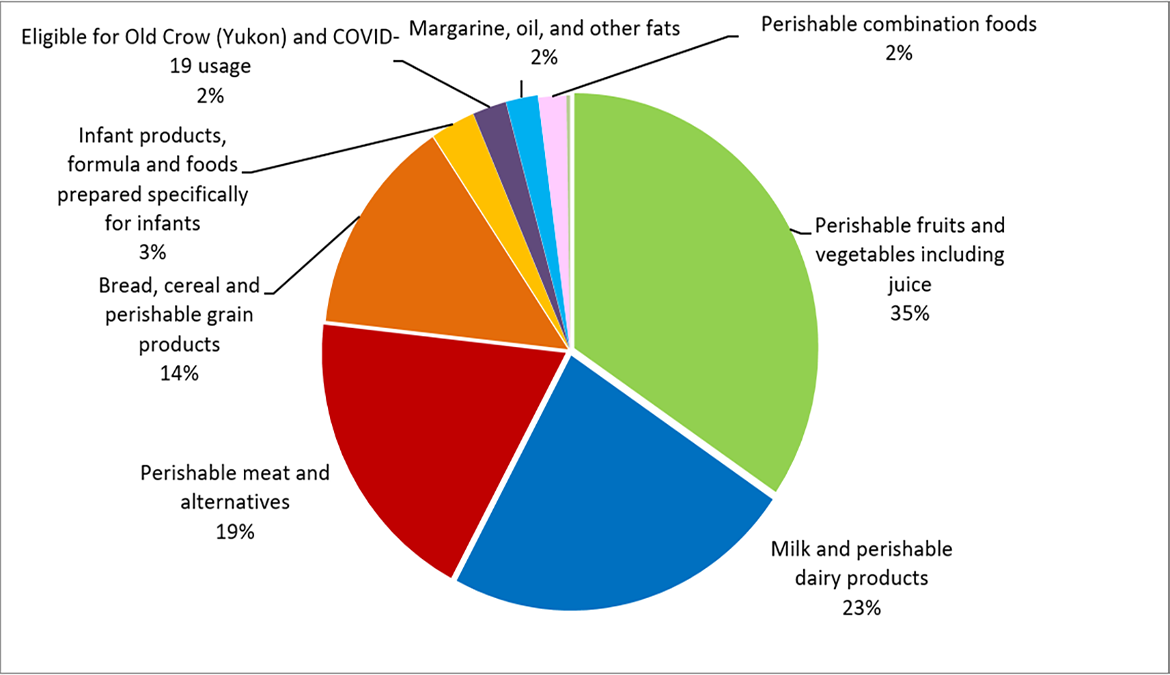
This chart shows what percentage of total subsidy payments was applied to specific product categories between April 1, 2020 and June 30, 2020. Categories that received less than 1% of the subsidy payments are not shown in the chart.
Data by product categoryText alternative for Data by product category:
The pie graph breaks down the total amount of subsidy spending between April 1, 2020 and June 30, 2020, by categories of eligible products as follows:
perishable fruits and vegetables, including juice: 35%
Fruit and vegetables (fresh and frozen): 29%
Unsweetened juice: 5%
milk and other perishable dairy products: 23%
Milk (fresh, UHT, and canned evaporated): 16%
Cheese, yoghurt and other dairy products: 8%
perishable meat and alternatives: 19%
Meat, poultry and fish (fresh and frozen): 14%
Eggs and egg substitutes: 4%
Nuts, seeds, peanut butter and other nut butters, tofu and other meat alternatives: 0%
bread, cereal and other perishable grain products: 14%
infant products: 3%
perishable combination foods: 2%
margarine, oil and other fats: 2%
eligible only for the community of Old Crow (Yukon) and COVID-19 usage: 2%
other: 0%:
dried herbs & spices, cooking juice: 0%
non-prescription drugs: 0%
personal hygiene products: 0%
country food: 0%.
Data by province or territory and region
This table shows the amount of subsidy that was distributed by province or territory and region between April 1, 2020 and June 30, 2020, and the product quantities that were subsidized The province or territory are listed in descending order based on the amount of subsidy. Numbers in the table are preliminary. Values are subject to change. Numbers may not add up due to rounding.
Province / territory
Region
Subsidy
Volume
Value ($)
% of Total
Weight (kg)
% of Total
Nunavut
Baffin
8,928,652
28%
1,945,643
19%
Kivalliq
3,160,357
10%
1,007,893
10%
Kitikmeot
1,859,953
6%
584,508
6%
Nunavut Total
13,948,962
43%
3,538,045
34%
Quebec
Nunavik (Northern Quebec)
6,330,538
20%
1,687,531
16%
Quebec North Shore1
57,552
0%
22,859
0%
Quebec Total
6,388,090
20%
1,710,389
16%
Ontario
Ontario Total
4,491,962
14%
1,992,500
19%
Manitoba
Manitoba Total
5,033,215
16%
2,323,834
22%
Northwest
Territories
Sahtu
664,966
2%
211,560
2%
Beaufort-Delta
424,752
1%
111,632
1%
Great Slave Lake
261,574
1%
77,395
1%
Northwest Territories Total
1,351,292
4%
400,588
4%
Newfoundland and Labrador
Newfoundland and Labrador Total
666,966
2%
257,397
2%
Saskatchewan
Saskatchewan Total
296,236
1%
137,917
1%
Alberta
Alberta Total
217,677
1%
95,486
1%
Yukon
Yukon Total
57,797
0%
20,127
0%
Total
32,452,197
100.0%
10,476,283
100%
1Quebec North Shore communities are eligible for a subsidy from Nutrition North Canada during the months when there is no marine service to these communities (generally from January to March).
This chart shows weight shipped for each province and territory, split between the subsidy levels available between January 1, 2019 and March 31, 2019. This graph is based on the table below.
Weight shipped for each province and territory:Text alternative for Weight shipped for each province and territory:
The chart breaks down the total amount of weight shipped between April 1, 2020 and June 31, 2020, by subsidy level and province/territory, as follows:
Province or territory
Category Weight (kg)
High
Medium
Low
Country Food
Seasonal Surface Transportation
Alberta
65,512.30
14,861.10
15,112.60
Manitoba
1,334,384.30
294,591.30
363,435.70
88.90
Newfoundland and Labrador
201,716.50
18,778.40
36,902.40
Northwest Territories
278,170.80
47,537.20
65,414.10
9,465.40
Nunavut
2,412,696.40
429,606.90
634,096.50
889.80
60,754.90
Ontario
1,493,140.70
325,297.90
502,174.60
3,221.20
Quebec
1,143,903.70
139,750.10
412,820.30
13,915.00
Saskatchewan
90,020.30
12,182.80
35,714.10
Yukon
13,052.50
1,541.20
5,533.30
Grand Total
7,032,597.50
1,284,146.90
2,071,203.60
889.80
87,445.40
Data by community
This table shows the amount of subsidy that was distributed by community between April 1, 2020 and June 30, 2021, and the product quantities that were subsidized during this period. Within a province or territory, communities are listed in alphabetic order. Numbers in the table are preliminary. Values are subject to change. Numbers may not add up due to rounding.